# 从(左上,右下)转换到(中间,宽度,高度)
def box_corner_to_center(boxes):
    x1, y1, x2, y2 = boxes[:,0], boxes[:, 1], boxes[:, 2], boxes[:,3]
    cx = (x1 + x2) / 2
    cy = (y1 + y2) / 2
    w = x2 - x1
    h = y2 - y1
    boxes = torch.stack((cx, cy, w, h), axis = -1)
    return boxes
# 从(中间,宽度,高度)转换到(左上,右下)
def box_center_to_corner(boxes):
    cx, cy, w, h = boxes[:, 0], boxes[:, 1], boxes[:, 2], boxes[:, 3]
    x1 = cx - 0.5 * w
    y1 = cy - 0.5 * h
    x2 = cx + 0.5 * w
    y2 = cy + 0.5 * h
    boxes = torch.stack((x1, y1, x2, y2), axis=-1)
    return boxes
# bbox是边界框的英文缩写
dog_bbox, cat_bbox = [60.0, 45.0, 378.0, 516.0], [400.0, 112.0, 655.0, 493.0]
boxes = torch.tensor((dog_bbox, cat_bbox))
box_center_to_corner(box_corner_to_center(boxes)) == boxes
tensor([[True, True, True, True],
        [True, True, True, True]])
def bbox_to_rect(bbox, color):
    # 创建一个 matplotlib 的 Rectangle 对象
    # xy=(bbox[0], bbox[1]) 表示矩形的左上角坐标
    # width = bbox[2] - bbox[0] 表示矩形的宽度,即右下角x坐标减去左上角x坐标
    # height = bbox[3] - bbox[1] 表示矩形的高度,即右下角y坐标减去左上角y坐标
    # fill=False 表示矩形内部不填充颜色
    # edgecolor=color 表示矩形的边框颜色为指定的颜色
    # linewidth=2 表示矩形的边框线宽为2
    return d2l.plt.Rectangle(
        xy = (bbox[0], bbox[1]), width = bbox[2] - bbox[0], height = bbox[3] - bbox[1],
        fill = False, edgecolor = color, linewidth = 2)
# 定义一个函数,用于读取香蕉检测数据集 图像和标签
# 参数 is_train 是一个布尔值,默认为 True,表示是否读取训练集数据。如果为 True 则读取训练集,否则读取验证集
def read_data_bananas(is_train = True):
    # 调用 d2l 工具包中的 download_extract 函数,下载并解压 'banana-detection' 数据集
    # data_dir 是解压后数据集所在的目录路径
    data_dir = d2l.download_extract('banana-detection')

    # 根据 is_train 的值确定要读取的 CSV 文件路径
    # 如果 is_train 为 True,则读取训练集的标签文件 'banana_train/label.csv'
    # 如果 is_train 为 False,则读取验证集的标签文件 'banana_val/label.csv'
    csv_fname = os.path.join(data_dir, 'bananas_train' if is_train else 'bananas_val', 'label.csv')

    # 使用 pandas 库的 read_csv 函数读取 CSV 文件,将其存储为一个 DataFrame 对象
    csv_data = pd.read_csv(csv_fname)

    # 将 DataFrame 的索引设置为 'img_name' 列,方便后续根据图像名称进行索引操作
    csv_data = csv_data.set_index('img_name')

    # 初始化两个空列表,用于存储图像数据和对应的目标标签数据
    images, targets = [], []

    # 遍历 DataFrame 的每一行,img_name 是图像名称,target 是对应的标签信息
    for img_name, target in csv_data.iterrows():
        # 使用 torchvision.io.read_image 函数读取图像文件
        # 根据 is_train 的值确定图像所在的文件夹路径
        # 如果 is_train 为 True,则从 'bananas_train/images' 文件夹中读取图像
        # 如果 is_train 为 False,则从 'bananas_val/images' 文件夹中读取图像
        images.append(torchvision.io.read_image(
            os.path.join(data_dir, 'bananas_train'  if is_train else 'bananas_val', 'images', f'{img_name}')))

        # 将当前图像的标签信息转换为列表,并添加到 targets 列表中
        targets.append(list(target))

    # 将 targets 列表转换为 PyTorch 张量,并在第 1 维上增加一个维度(unsqueeze(1))
    # 最后将所有目标标签的坐标值除以 256,进行归一化处理
    return images, torch.tensor(targets).unsqueeze(1) / 256
read 1000 training examples
read 100 validation examples
torch.Size([32, 3, 256, 256]) torch.Size([32, 1, 5])
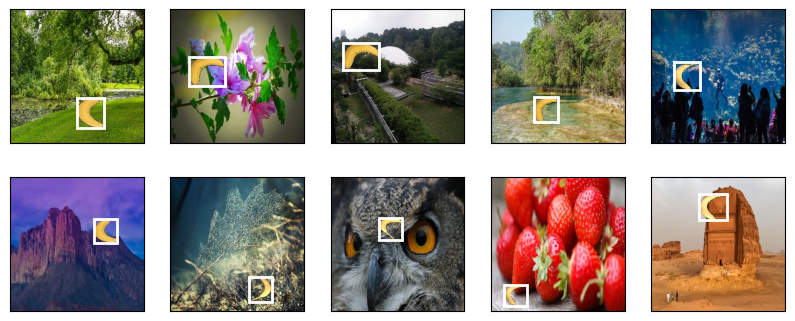
# 从当前批次的图像数据(batch[0])中选取前 10 张图像
# 原始图像数据的形状通常为 (批量大小, 通道数, 高度, 宽度),这里使用 permute(0, 2, 3, 1) 将通道维度移到最后,变为 (批量大小, 高度, 宽度, 通道数)
# 同时,将像素值从 [0, 255] 归一化到 [0, 1] 范围,因为后续的图像显示函数通常期望像素值在这个范围内
imgs = (batch[0][0:10].permute(0, 2, 3, 1)) / 255

# 使用 d2l 工具包中的 show_images 函数展示图像
# imgs 是要展示的图像列表
# 2 和 5 分别表示将图像排列成 2 行 5 列的网格
# scale=2 表示将图像的显示大小放大 2 倍
# axes 是返回的每个子图的坐标轴对象列表
axes = d2l.show_images(imgs, 2, 5, scale=2)

# 遍历每个子图的坐标轴对象和对应的前 10 个标签
# zip(axes, batch[1][0:10]) 将坐标轴对象和标签一一对应起来
for ax, label in zip(axes, batch[1][0:10]):
    # 对于每个子图,使用 d2l 工具包中的 show_bboxes 函数绘制边界框
    # ax 是当前子图的坐标轴对象
    # [label[0][1:5] * edge_size] 表示要绘制的边界框信息
    # 这里 label[0][1:5] 取出了边界框的坐标信息(通常索引 1 到 4 是边界框的坐标),乘以 edge_size 是将归一化的坐标还原到原始图像尺寸
    # colors=['w'] 表示边界框的颜色为白色
    d2l.show_bboxes(ax, [label[0][1:5] * edge_size], colors=['w'])


